Water Quality DAQ is Going Up

**Update**
The Water Quality DAQ is online.

The Water Quality DAQ chapter is going up over the weekend.  It tracks

  • Water Temperature
  • pH
  • Dissolved Oxygen

Water Quality DAQ.

Some new features, which will be added in an update to the Environment DAQ, are an easy method of grabbing past data and displaying the last time the Arduino synced along with the last time the screen refreshed.


New ability to see past data.

Similar to past projects,
  • You can set email and SMS alerts when data moves outside of your defined ranges.  
  • The gauges are used for real-time graphing

New External Relays

When we developed the Aquaponics Controller we knew one important design characteristic would be the option of having external relays that are already assembled and enclosed for those uncomfortable with mains level wiring.  And not for nothing, but external relays also have the added benefit of being replaceable.

Relay board ready for wiring and 3D printed enclosure.

This board features a 20A, SPST-NO relay with traces (big traces) to match and a more intuitive 5V control logic than other external relay boards for the Arduino platform.

You can find this kit in our store.

Tutorials:

Aquaponics Controllers Have Shipped

The first batch of Aquaponics Controllers have shipped!  These units are single-point, full-system controllers that are used for Aquaponics Tracker.
  • Triple-mode pump control: always on, toggle, manual
  • Depth sensor
  • Smart grow-light control 
  • Optionally use external (and therefore replaceable) relay kits
  • Water temperature
  • Industrial grade pH probe 
  • Industrial grade dissolved oxygen probe
  • Air temperature
  • Relative humidity
  • Ambient light intensity
  • Replaceable sensors
  • Uses an Arduino Mega R3 and Arduino Ethernet Shield R3
  • For use with Aquaponics Tracker or a stand-alone application
Note the application of the relays is a matter of programming rather than hardware so they are configurable as well.

Figure 1.  Early PCB layout.


Figure 2.  Aquaponics Shield.

Dry fitting components together is a no-brainer.  Below you can see the silkscreen layer printed on paper and taped to some random foam, which is excellent at holding component leads in place.  The dissolved oxygen, pH, differential pressure transducer and water temperature parts protrude from the bottom of the unit (left in the picture).

Figure 3.  Always good to dry fit.


Figure 4.  Dry fit again.


Figure 5.  Full kit.

We can't wait to get them into our 3D printed enclosures.

The Arduino Ethernet Board

Let's face it, the Environment DAQ stack is big.  Using an Uno, an Ethernet Shield and the DAQ Shield makes a sizable footprint by itself and 3D printing an enclosure for it takes hours.  To reduce this time sink, we started looking at the Arduino Ethernet board.

Arduino Ethernet R3 w/o PoE.  Credit:  Arduino.

The Arduino Ethernet board combines the Arduino Uno and Arduino Ethernet Shield into a single board.  It features the same 14 digital I/O and 6 analog input pins, but similar to the stack configuration, the Ethernet interface takes over pins 10, 11, 12 and 13.

The only significant difference when using this board for the Environment DAQ, is the missing USB-serial driver - it was removed to make room for the Ethernet interface.  So how do you upload sketches and output to serial?  Well, you'll need to use an FTDI breakout board or FTDI-USB cable.  For this example, we'll use Sparkfun's FTDI Basic Breakout - 5V board.

Sparkfun's FTDI Basic Breakout - 5V.  Credit:  Sparkfun.

Arduino Ethernet with FTDI Breakout.

Orient the breakout board as seen above such that the "BLK" pin on the Arduino Ethernet lines up with the pin labelled "GND BLK" on the breakout board.  From there, you use a mini-USB cable to connect from the FTDI breakout board your computer.  

When uploading the sketch, you need to select the Arduino Ethernet board from the list of available boards.  On Ubuntu, we found the the Serial port changed from our usual ttyACM- to ttyUSB-.

There isn't anything you need to do for the sketch or shield, they work exactly the same as before, however, we noticed the time it takes to initialize the shield was much longer than on the original stack (operational performance was unchanged).


Arduino Aquaponics: JSON

**UPDATE**
To see JSON, have a look at the Pump Controller project.

In a previous post, Online Relay Control, we demonstrated how to manually trigger a relay from a web application.  The Arduino polled App Engine on a set interval and received the status of the relay as a string; the Arduino sketch parsed the response and then analyzed the response using "if" conditionals.

While that works well for setups involving a single relay, we realize it is inherently limiting, particularly for those who want to control two relays with their Environment DAQ.  Similarly, we wanted to pair the Depth Sensor with two pumps that could be controlled independently and we needed a method of differentiating them with data from a single response.  Enter JSON.

To parse the JSON, you need aJson Library made by Marcus Nowotny.  Download, extract it and put a copy in your libraries folder.  Name the it aJSON.

The Arduino sketch below receives the following response for a GET request:

{'RELAY1': 'ON'}

and then toggles the relay.


You can see then, that returning more than one key-value pair can still be parsed from a single request.

Depth Sensor

The hardware was built directly from the Practical Arduino project, but the source code was almost completely overhauled to handle App Engine and our tank visualization, which you can see in action on the Aquaponics Tracker page.

Figure 1.  Depth sensor PCB.  The differential pressure transducer is bottom right.

Why track depth?  Actually, there are a number of reasons.  As you can see in Aquaponics Tracker, you can combine stock information with the depth to monitor the stocking density during system cycling.  You can monitor the depth for potential leaks, automatically refill the stock tank from a sump tank (due to losses from plant growth, evaporation, etc.) and when paired with pump control, you can prevent overflows and/or cycling too much water.

You can see the schematic for the depth sensor below.  The drawing is nearly identical to the Practical Arduino schematic, but we added the missing capacitor for noise reduction.

Figure 2.  Depth sensor schematic with missing capacitor.

Real-Time Clock - Part II: Grow Light Controller

In Part I of this tutorial, you learned how to set up the ChronoDot  with the Arduino and use it to track time.  Part II continues the discussion by creating a timer that can be used to control grow lights.

In a previous post we talked about the importance of light for plants and the role grow lights play in Controlled Environment Agriculture either by monitoring current light levels and providing supplemental light, or by providing all of the light for a fixed time every day.  Part II focuses on the latter, creating a timer which toggles a light on at a certain time of day, toggles it off at another and uses the ChronoDot to track the time.


Parts List
1 x Arduino Uno R3 (IDE 1.0.3)
1 x ChronoDot
1 x PowerSwitch Tail II Relay
6 x Jumper wires


Fritzing Diagram


Figure 1.  Grow Light Timer diagram.

Arduino Libraries
In addition to the libraries from Part I, you will need two new libraries for this sketch:  Time and TimeAlarms.  The Time library is used to set the Arduino's system time as well as to compare times during the initial setup.

TimeAlarms is used to create two alarms, one for the time each day the light is turned on, and a second alarm for the time of day the light is turned off.

Download both zip files, extract them and move a copy into your Arduino's libraries directory.


Arduino Sketch
This sketch takes two times, given as hour, minute and second and creates an alarm for each.  When you first launch the script, the start time and end time are compared to the current time.  If the current time is between the two times, the relay is toggled ON.

During each operational loop, the current time is retrieved from the ChronoDot, the system time is reset and the current time is displayed.


Real-Time Clock - Part I

A fundamental necessity of any controls system is the ability to track time.  As far as we are aware, the Arduino has three methods it can employ:
  1. Serial.  Repeatedly get the time over the Serial connection.
  2. External Hardware.  Real-time clocks, like the ChronoDot from Macetech, establish a base time when the Arduino sketch is compiled.  When you request the current time in the sketch you actually receive a time based on the time that has elapsed since compilation.
  3. Ethernet.  Access time using the internet NTP service.
This tutorial set focuses on option 2.  In Part I we explain the basics of getting the ChronoDot set up and displaying the current time over serial.

The ChronoDot

The ChronoDot is a high precision real-time-clock (RTC) and boasts a number of features needed for Aquaponics. The V2.1 release introduced the DS3231SN chip, which has an industrial temperature range of -40C to +85C and outputs a temperature compensated time - important for aquaponic control systems that reside outdoors in the heat and direct sun.  
Figure 1.  The ChronoDot V2.1, credit Macetech.

The ChronoDot includes an onboard battery cell for a CR1632 battery, allowing the clock to keep track of time should the Arduino lose power, regain power and restart. Anyone in aquaponics can appreciate the ability of a control system to automatically reboot and resume operation in the event of a power glitch. The disadvantage of the ChronoDot, and RTCs in general is the inability to handle Daylight Savings Time.

The Environment DAQ can be configured with the ChronoDot using the prototyping area, which is exactly wide enough to handle the RTC (coincidence?). If mounting to the shield, you can access the pins from the bottom.
Figure 2.  Environment DAQ Shield with ChronoDot.

Parts List
1 x ChronoDot
1 x Arduino Uno R3
4 x Jumper Wires

Mounting the ChronoDot
The Fritzing diagram below shows how to connect the ChronoDot to the Arduino. Note that the RTC connections are on the right-hand side - the pins on the other side are not used.


Figure 2.  Connecting the ChronoDot.

Arduino Library
The ChronoDot requires two libraries
  1. Wire.h - Included with the Arduino
  2. RTClib.h - Download here.
Download the zip file and extract it. If necessary, rename the extracted folder "RTClib", and then move a copy into your Arduino libraries directory.

Arduino Sketch
Part I of this tutorial simply outputs the current time from the RTC to Serial; part two shows how to set create a toggle time.


Environment DAQ Demo

A live demo of the Environment DAQ is online:

New Google+ Community

We have a new community on Google+:  Automating Aquaponics and Hydroponics.  Here you can get help, find ideas, share your passion and find updates.


Environment DAQ Update 2.2

Version 2.2 brings the new overview container as well as some updates to the CSS files for Firefox.


You can download Version 2.2 here.

Grow Bed DAQ Quad View

The Grow Bed update brings three new features.  At the top of the webapp, there is now an overview container, with gauges for each parameter.

Figure 1.  Overview gauges and quad view layout.


In addition, there is a second CSS file to create the quad view layout shown above.  To implement it, edit /templates/main/scripts.html.  Edit the bottom of the file as shown in Figure 2.  Note the quad view is created only for screen sizes larger than 1200px.

Figure 2.  Edit the CSS link.

Lastly, the check for updates function now includes a download button to download the app within the webapp.

Arduino Aquaponics: EnvDAQ with Water Temperature Sensor

Introduction
The 
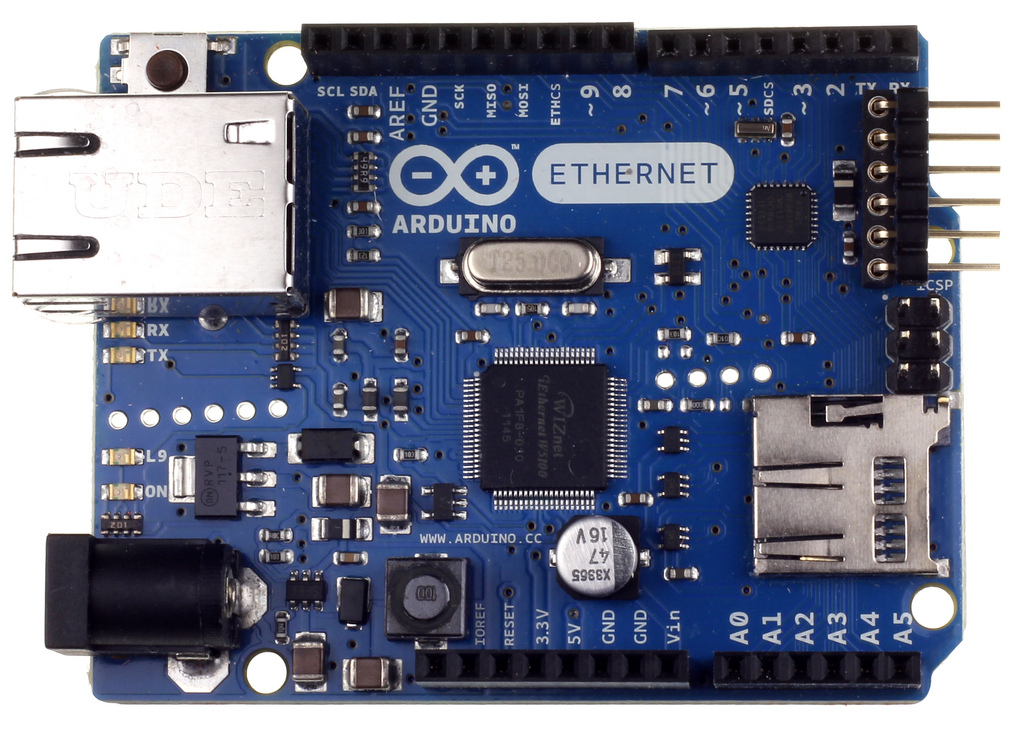
Environment DAQ is an open source Arduino shield used to track air temperature, relative humidity and light in aquaponic and hydroponic grow beds.  An equally important parameter to track is root temperature and with the new prototyping area on the v2 Environment DAQ boards, it is easy to add a new sensor.

The goal is to add the water temperature sensor to the other sensors on the Arduino  shield.

This tutorial requires that you have already completed the tutorials: Environment DAQ and Water Temperature.  You can download the complete source code here.

Part I:  Arduino
In Figures A and B you can see the Fritzing diagrams.  Figure A shows the full Environment DAQ with the DS18B20 integrated in and Figure B shows it solo.

Figure A.  Full EnvDAQ with DS18B20 to digital pin 5.

Figure B.  DS18B20 solo to digital pin 5.

To start upgrading the Arduino sketch, include the one-wire libraries and the sensor information.

Figure C.  Include statements and assignments.
The DS18B20 is a one-wire sensor, meaning you could run more than one sensor to the same digital port and differentiate the values using the device address.  At the bottom of the highlighted code in Figure C you will find the device address for our DS18B20 used for the this tutorial.  The link above it is a tutorial for finding the address of your specific sensor.

 Figure D shows a miscellaneous string used to temporarily hold the water temperature reading.

Figure D.  Temporary string for holding the water temperature reading.

In setup(), we need to add the commands to begin the sensor and set the resolution - Figure E.

Figure E.  setup() commands for the DS18B20

Each sensor in the main loop resets a string to blank, requests the data string from its function and outputs the new string to Serial.  You can comment out the Serial when you put this into operation.

Figure F.  DS18B20 loop() code.

 Next, add the string from Figure F to the end of the GAE request - Figure G.

Figure G.  Add the water temp string to the end of the web request.

Finally, create the function that gets the root temperature and converts it from Celsius to Fahrenheit and finally, to the string the web request uses.


Part II: App Engine
To make this process as easy as possible, cut and paste the temperature code and add a "w" or "W" in the places shown.  This will dramatically decrease the chances of typo errors and the time this upgrade takes.

UserPrefs Model & Settings Template
Open settings.py and edit the UserPrefs model.  Add in the properties for water temperature minimum and water temperature maximum preferences - Figure 1.  This is the first example of the suggestion above about copy and pasting the temperature property data; here, copy and paste and a "w" to the beginning.


Figure 1.  Water temperature min and max preferences.

Scroll down settings.py and add the form variables below the light properties.

Figure 2.  Water temperature variables for settings form.

The water temperature preferences are in a template (which we will create in a minute).  First, add the code from Figure 3 to render the (yet-to-be-created) water temperature template and pass in the preferences.

Figure 3.  Render the water temperature template.

The water temperature template is loaded into the /templates/settings/content.html template - the main settings template.  Edit the template rendering code to pass in the water temperature template - Figure 4.

Figure 4.  Pass the water temperature template into the main template.

Next, edit /templates/settings/content.html by adding in the template variable for the water temperature template from Figure 4.

Figure 5.  Edit content.html for the new water temperature template.

Finally, create the water temperature template: water_temp.html.  Again, this is easily done by copying and pasting the original temperature.html code and add the "w" in places.  The full template is in Figure 6.

Figure 6.  Water temperature template.

Launch the web application in the sandbox and go to Settings to check the templates are loading correctly.

Figure 7.  Water temperature template rendered in Settings tab.

Saving Water Temperature Preferences
To save the preferences for water temperature, start by creating the onclick handler in javascript.  Open settings.js, copy the original saveTempSettings() function and edit for water temperature - Figure 8.

Figure 8.  Onclick handler for water temperature save button.

The onclick handler makes an asynchronous request to the server, so we need a request handler to process the request.

Figure 9.  Request handler for water temperature form.

Add the new request handler to the bottom so the request is properly routed.

Figure 10.  Request handler link.

Finally, reload the settings page in the sandbox and save water temperature settings.

Environment.py:  EnvData Model
In environment.py, amend the data model to include the water temperature parameter.


Figure 11.  EnvData water temperature property.

Adacs.py:  Arduino Request Handler
The request handler for the Arduino is in adacs.py.  Start by getting the water temperature argument passed from the Arduino and assigning it to WTemp.  Optionally, you can add a logging command to spit out the data that is passed.

Figure 12.  Arduino argument.

Next, assign the WTemp argument to the WTemp property of the EnvData model created in Figure 11.

Figure 13.  Assign the new argument to the WTemp property  of the EnvData entity.

One of the major upgrades to the EnvDAQ cloud application is the use of memcache.  Memcache stores data in system memory for a limited time and is specifically used here to hold the current parameters sent by the Arduino in order to reduce datastore read operations.  The original ~17,000+ read operations have been cut by a third, reducing the system load (and the potential for the server to instantiate new instances) and speeds up response times from the browser to the server.  Similarly, user preferences are stored in memcache.

Append the EnvNow assignment to include WTemp, before it is put in memcache.


Figure 14.  EnvNow with water temperature reading.

Test the Arduino request handler by typing in the following url in your browser

localhost:8080/adacs/arduino?Temp=84.1&Humidity=69.8&AmbientLDR=850&WaterTemp=75.0

If everything is working, the application will return "Connected".  To confirm the data was saved, open the Admin Console (localhost:8000/)  and then open Datastore Viewer.


water_temp.js
Just as we have JavaScript files for temperature, relative humidity and light, we need one for water temperature.  Create a new file: /static/scripts/water_temp.js and add the following

// Shared Aspects
var WTData = [['Time', 'WaterTemp', 'Min', 'Max']];       // Data for all water temp visualizations
var wtempChartData;

// Main Table
var wtempTable;

// Chart
var wtempChart;
var wtempChartOptions;

// Gauge
var wtempGauge;
var wtempGaugeData;
var wtempGaugeOptions;


function drawWTempTable() {
     // Chart data
     wtempChartData = google.visualization.arrayToDataTable(WTData);
     
     // Assign new visualization to DOM element
     wtempTable = new google.visualization.Table(document.getElementById('wtempTable'));
     
     // Draw Table
     wtempTable.draw(wtempChartData);
}     

function updateWTempTable(Time, TempValue, MinTemp, MaxTemp) {
     // Get the last row number
     var lastRow = wtempChartData.getNumberOfRows();
     
     // Get the value of the last row
     var timeStamp = wtempChartData.getValue(lastRow - 1, 0);
     
     //alert(timeStamp + ' ' + TempValue);
     if (timeStamp == 'Now') {
          wtempChartData.removeRow(0);
     }
     
     
     wtempChartData.addRow([Time, TempValue, MinTemp, MaxTemp]);
     wtempTable.draw(wtempChartData);     
     
}

/////////////////////////////////////////////////////////////////////////////////////////////////

function drawWTempChart() {
     wtempChart = new google.visualization.LineChart(document.getElementById('wtempChart'));
     wtempChartOptions = {         
       animation: {duration: 1000, easing: 'out'},
       backgroundColor: { fill: "none" }
     };
     wtempChart.draw(wtempChartData, wtempChartOptions);          
}


function updateWTempChart() {
     wtempChart.draw(wtempChartData, wtempChartOptions);
}


///////////////////////////////////////////////////////////////////////////////////////////////
/* Draws Water Temperature Gauge Using Water Temperature Chart Data */
function drawWTempGauge() {    
     var lastRow = wtempChartData.getNumberOfRows();
     var lastTemp = wtempChartData.getValue(lastRow - 1, 1);
     var minTemp = wtempChartData.getValue(lastRow - 1, 2);
     var maxTemp = wtempChartData.getValue(lastRow - 1, 3);
     
     //alert('MinTemp: ' + String(minTemp) + ' ' + 'MaxTemp: ' + String(maxTemp));
     
     
     wtempGaugeData = google.visualization.arrayToDataTable([
       ['Water'],
       [lastTemp]
     ]);
     
     wtempGauge = new google.visualization.Gauge(document.getElementById('wtempGauge'));
     wtempGaugeOptions = {          
       min: 0,
       max: 100,
       redFrom: 0, redTo: minTemp,
       greenFrom: minTemp, greenTo: maxTemp,
       yellowFrom: maxTemp, yellowTo: 100,        
       minorTicks: 5       
     };
     wtempGauge.draw(wtempGaugeData, wtempGaugeOptions);
}

function updateWTempGauge(TempValue, Threshold) {
     wtempGaugeData.setValue(0, 0, TempValue, Threshold);           
     wtempGauge.draw(wtempGaugeData, wtempGaugeOptions);
     
}

The new script needs to be loaded with the others.  Open /templates/main/scripts.html and insert the new script below light.  Do not put this script first - temp.js must be first.


Figure 15.  Include water_temp.js with the other JavaScript  for main.

Next, add the GCT elements referenced in water_temp.js to /templates/main/content.html.

Figure 16.  Div elements for water temperature GCT.


Main.js:  getChartData()
The AJAX request to the server to get the chart data on load is in /static/scripts/main.js. The function getChartData needs to amended in two places.  The first creates dummy data in the event the Arduino has not uploaded any data from the aquaponic/hydroponic system.

Figure 17.  Dummy placement data.

The second place pushes data to the WTData array created at the top of /static/scripts/water_temp.js.

Figure 18.  Add data to WTData array.

Finally, edit drawCharts() to include calls to water temperature.

Figure 19.  drawCharts with new water temperature function calls.


Environment.py:  GetChartData
The request handler for getting chart data is in environment.py.  Edit GetChartData so that it returns the water temperature data and preferences.

Figure 20.  GetChartData returning water temperature data and preferences.

Test
At this point you should be able to reload the main page of the webapp and be presented with the new charts for water temperature.

Figure 21.  New water temperature container.

Main.js:  UpdateChart
The second to last App Engine upgrade is getting the chart data for real-time graphing.  There are four places we need to edit /static/scripts/main.js.  First, add the lines from Figure 22 to include the new water temperature data from the JSON object.

Figure 22.  Get water temp data from JSON.

The next edit deals with resetting the charts should a new day roll over - this way, you are always view the current day's data and reducing the browser load.

Figure 23.  Reset charts if a new day is detected.

The code in Figure 24 adds the data to the original data array as a redundant measure should your browser window change size and automatically redraw the charts.

Figure 24.  Add new data to original data array.

Finally, add the function calls that update the water temperature charts.

Figure 25.  Update water temperature charts.

Environment.py: UpdateChart
In environment.py we need to edit updateChartData().  The request handler is a conditional that tries to get the EnvNow data (as Environment) from memcache.  The first condition occurs if the memcache has expired.


Figure 26.  No memcache of current data.

The second condition returns evaluates the timestamp against the current data in memcache and returns the data only if the timestamps are different.

Figure 27.  Memcache is present and timestamps are different.

That's it!  The DS18B20 in this tutorial is meant for the grow beds, but the code would work if you put it in the stock tank as well.  If you want to take this a step further, you can plot both air temperature and water (root) temperature on the same chart for comparison.

Related Projects:
Environment DAQ
Pump Controller

Related Parts:
Water Temperature
Temp and Humidity
Light
pH
Dissolved Oxygen